Timeframe Color Indicator for MetaTrader 4
Experience enhanced charting with our new Timeframe Color Indicator for MetaTrader 4. This tool visually differentiates objects drawn in different timeframes with distinct colors.
Experience enhanced charting with our new Timeframe Color Indicator for MetaTrader 4. This tool visually differentiates objects drawn in different timeframes with distinct colors.
This week's AUD/USD outlook is shaped by technical and fundamental factors. The technical analysis suggests a potential bullish sweep at the 0.6805 level, while the fundamental analysis forecasts a gradual increase in the AUD/USD pair until August 2023, followed by a slight decrease.
Forecasts for the USD/CHF pair for the week of May 21-27, 2023, suggest a bearish trend with daily target values ranging from 0.8971 to 0.9058. The coming months indicate a mix of bearish and bullish trends.

Unveiling market patterns arising from accumulation & distribution, and the strategic timing of news releases by big institutions to sway stock trends.
Choosing a forex broker is pivotal to trading success. Explore the comparison between ICMarkets, XM, and RoboForex to make an informed choice today.

Gold price dipped to a 2-week low of $1985 on May 18, 2023, influenced by strong US economic data and Fed policy comments. Meanwhile, ongoing US debt ceiling talks aim to prevent a default by June 1.
The gold price for today, May 17, 2023, is approximately $1991.60 per troy ounce or $64.03 per gram. The price is expected to range between $1986.80 and $1997.00
Uncover the benefits of automating your Forex trades using Expert Advisors. Learn how EAs can boost your trading efficiency, profitability, and strategic decision-making.
Unlock the power of top-down multi time frame analysis in forex trading. A comprehensive guide to understand and implement this effective strategy for improved decision-making and profitability.
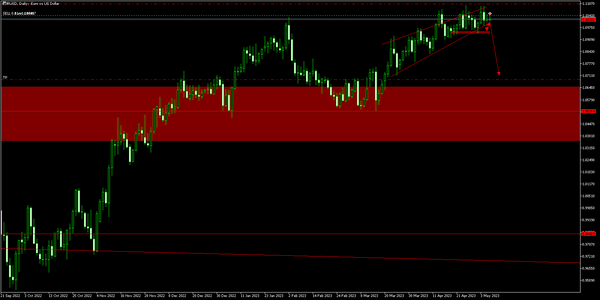
eurusd
EUR/USD exhibits a bearish outlook, with key technical indicators supporting downside momentum. The break below 1.1000 strengthens the bearish bias, and traders should monitor for potential short entries.
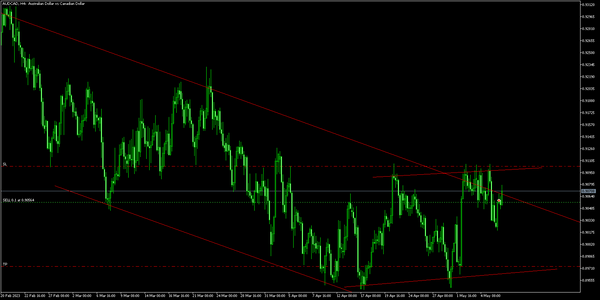
audcad
AUD/CAD formed a bullish double bottom pattern, implying a potential uptrend. Confirmation requires breaking neckline resistance at 0.9380. Technical indicators support a short-term bullish move.

INTRO: The world of investing can be a confusing one. With so many options available, it can be hard to decide where to put your money. One of the most common questions from novice investors is whether they should invest in bonds, stocks, or both. The answer really depends on