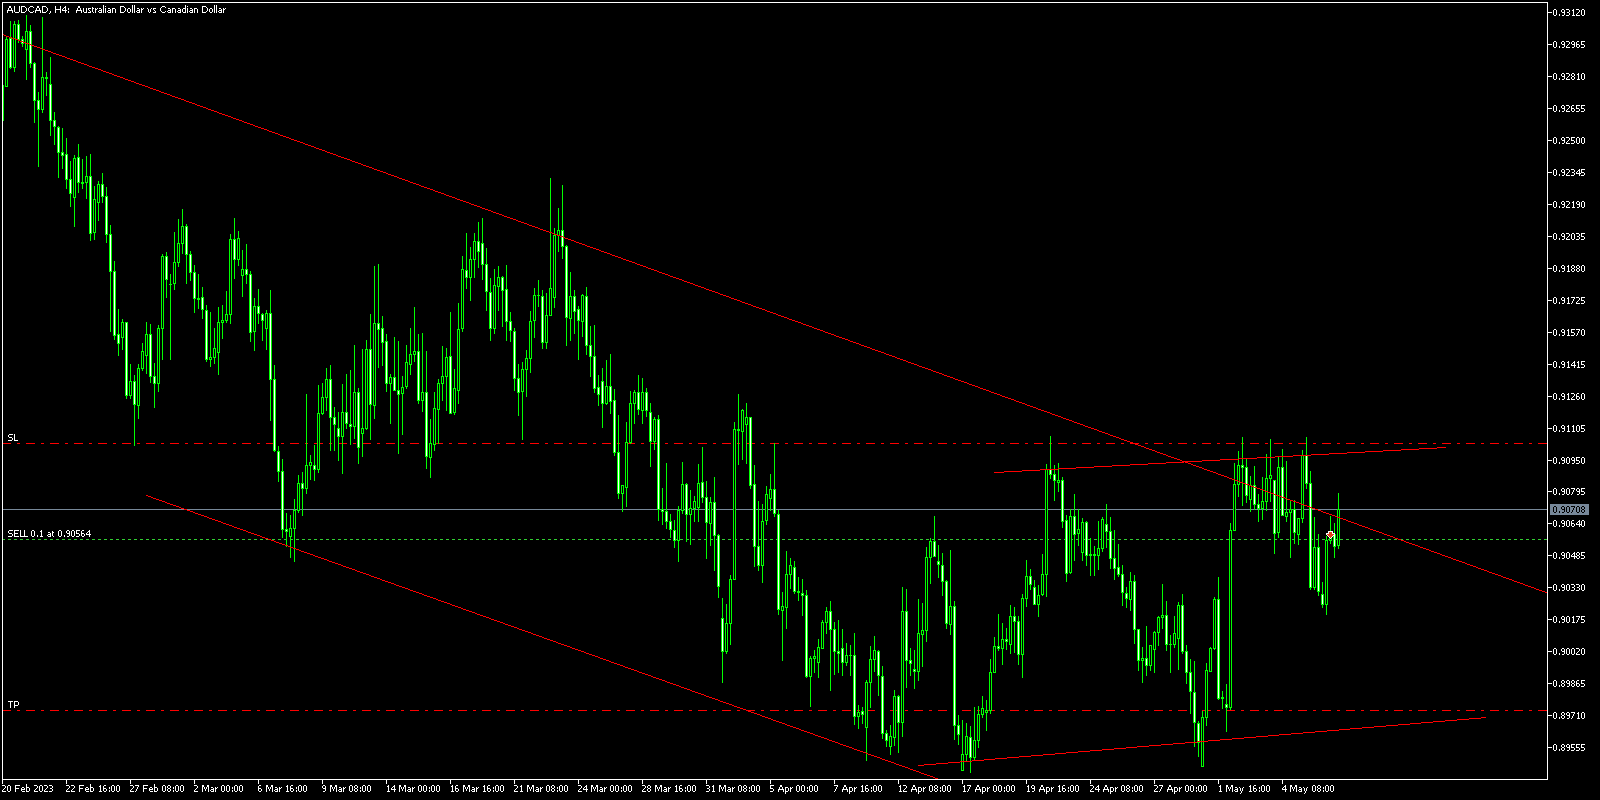
AUD/CAD Technical Analysis: Bullish Double Bottom Pattern Indicates Potential Upside
AUD/CAD formed a bullish double bottom pattern, implying a potential uptrend. Confirmation requires breaking neckline resistance at 0.9380. Technical indicators support a short-term bullish move.
Introduction:
The AUD/CAD currency pair has recently formed a double bottom pattern, a bullish technical chart pattern that indicates a potential reversal from a downtrend to an uptrend. This analysis provides a detailed technical breakdown of the current market setup and the factors that could support a bullish price movement for the week ahead. As a professional fund manager, I will utilize various technical indicators and charting tools to provide a comprehensive outlook on the AUD/CAD currency pair.
Technical Analysis:
- Double Bottom Pattern Formation:
The double bottom pattern is a bullish reversal pattern that typically forms after an extended downtrend. In the case of AUD/CAD, the pair has been trading in a downtrend since its peak in February 2023. Recently, the pair has formed two distinct lows at approximately 0.9200, creating a double bottom pattern. The neckline resistance, which connects the two peaks between the lows, is currently located at around 0.9380.
2. Confirmation of the Double Bottom Pattern:
For the double bottom pattern to be confirmed and considered a valid reversal signal, the price needs to break above the neckline resistance at 0.9380. A strong close above this level, preferably on increased volume, would signal the completion of the pattern and the start of a new bullish trend.
3. Supporting Technical Indicators:
- Relative Strength Index (RSI): The RSI, a momentum oscillator, is currently in the neutral territory around 50, which indicates that neither the bulls nor the bears have full control. However, an upward movement of the RSI above 50 would suggest increasing bullish momentum, supporting the double bottom pattern's reversal potential.
- Moving Averages: The AUD/CAD is trading above its 50-day moving average (DMA), a sign of short-term bullish momentum. If the pair can maintain its position above the 50-DMA, it will provide additional support for the bullish outlook.
- Fibonacci Retracement: The 38.2% Fibonacci retracement level from the February 2023 high to the recent double bottom lows coincides with the neckline resistance at 0.9380. A break above this level will further confirm the bullish reversal and provide a technical target of the 61.8% retracement level at around 0.9570.
Conclusion:
The AUD/CAD currency pair has formed a double bottom pattern, suggesting a potential bullish reversal after an extended downtrend. Confirmation of the pattern will require a break and close above the neckline resistance at 0.9380. Supporting technical indicators, such as the RSI, moving averages, and Fibonacci retracement levels, also point towards the possibility of a bullish move in the short term. Traders should monitor the pair closely for a potential long entry opportunity upon confirmation of the pattern and a break above the neckline resistance.